How the Commonwealth Games could save Adelaide: Part Four
Words: David Cooke
Above image: Adelaide's Riverbank

Over three instalments, architect David Cooke has told us why and how the Commonwealth Games could create a better future for Adelaide. In the final part of the series, he turn his thoughts toward the biggest question of all – how much will it cost, and how much will it be worth?
Find the first chapter in this four-part series here, the second part here, and the third instalment here.
Impact Cost Analysis
We have outlined in the previous instalments that one of the key challenges we aim to address is Adelaide and South Australia’s economic future.
As part of this report, we set an economic vision for ‘greater employment opportunities and an increase in economic sectors’. This vision was to be measured by the targets of transitioning to a knowledge-based economy supported by the education sector and by increasing employment diversity and opportunities within Adelaide.
In order to determine the economic results of the design proposal outlined in last week’s instalment three, we will initially consider the capital cost of the proposal with a focus on Stage 1 and 2, and from there we can propose an economic impact study. The capital costs associated with the design proposal have used capital comparisons from recent sporting events, such as Glasgow 2014 and London 2012 and quantity surveyor data from Australia, cross checked with relevant data from the United States and Europe. This has determined the likely estimated rates and capital costs for each component of the plan.
Stage 1 Capital Cost
The table below shows the capital expenditure for Stage 1. The largest item within this stage is the 1,323 units of infill housing. The light rail cost has been compared to recent projects in the Gold Coast, Adelaide’s own recent tram line extension and US based projects in Los Angeles and Cincinnati.

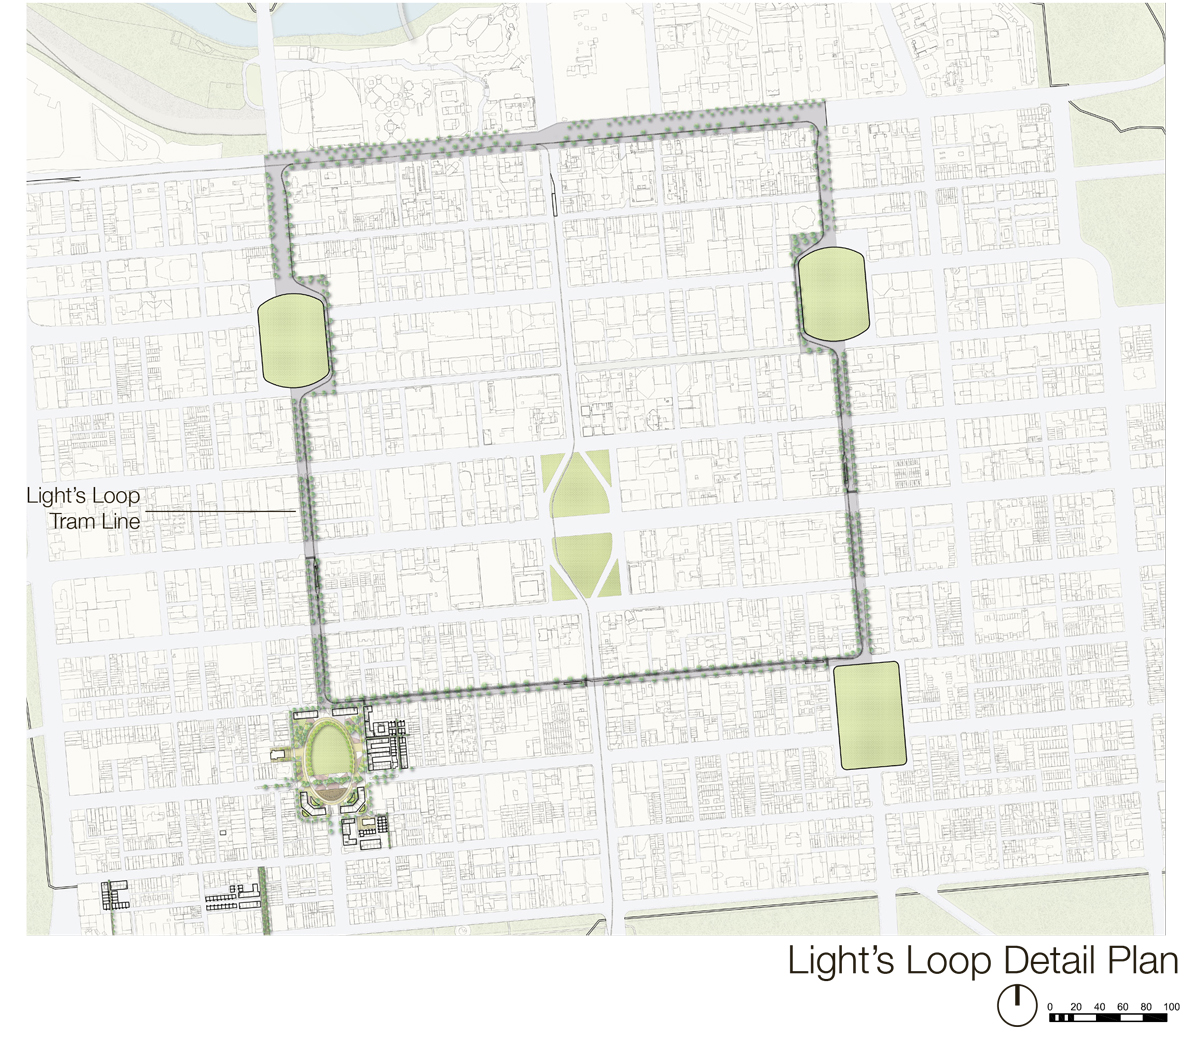
Stage 1 of the design proposal put forward minor projects within the city to deliver major urban and economic regeneration. One such element is Light’s Loop which has been estimated at $150m. Such a project could link the city’s precincts and repair Light’s original squares, while providing enhanced connectivity throughout the city. This public project could act as a catalyst for private sector development throughout the city and a greater citywide urban uplift.
Stage 2 Capital Cost
The following table shows the capital expenditure for Stage 2. This is not the entire delivery cost for Adelaide to host the Commonwealth Games but is more focused on the civic infrastructure outlined within instalment three. It is proposed that the Athletes housing could be delivered in partnership with the private sector.

Criticism associated with mega-sporting events of any type is often levelled at the costs of the stadium infrastructure. Under this proposal it is interesting to note that the stadia infrastructure cost is a smaller relative percentage of the overall cost. The stadia infrastructure itself will untimely become recreation amenity for the community. The use of an event deadline has the ability to focus the public spending over a defined timeline. It could be argued that much of the public infrastructure costs associated with the proposal would be invested by the public sector regardless of the Commonwealth Games.
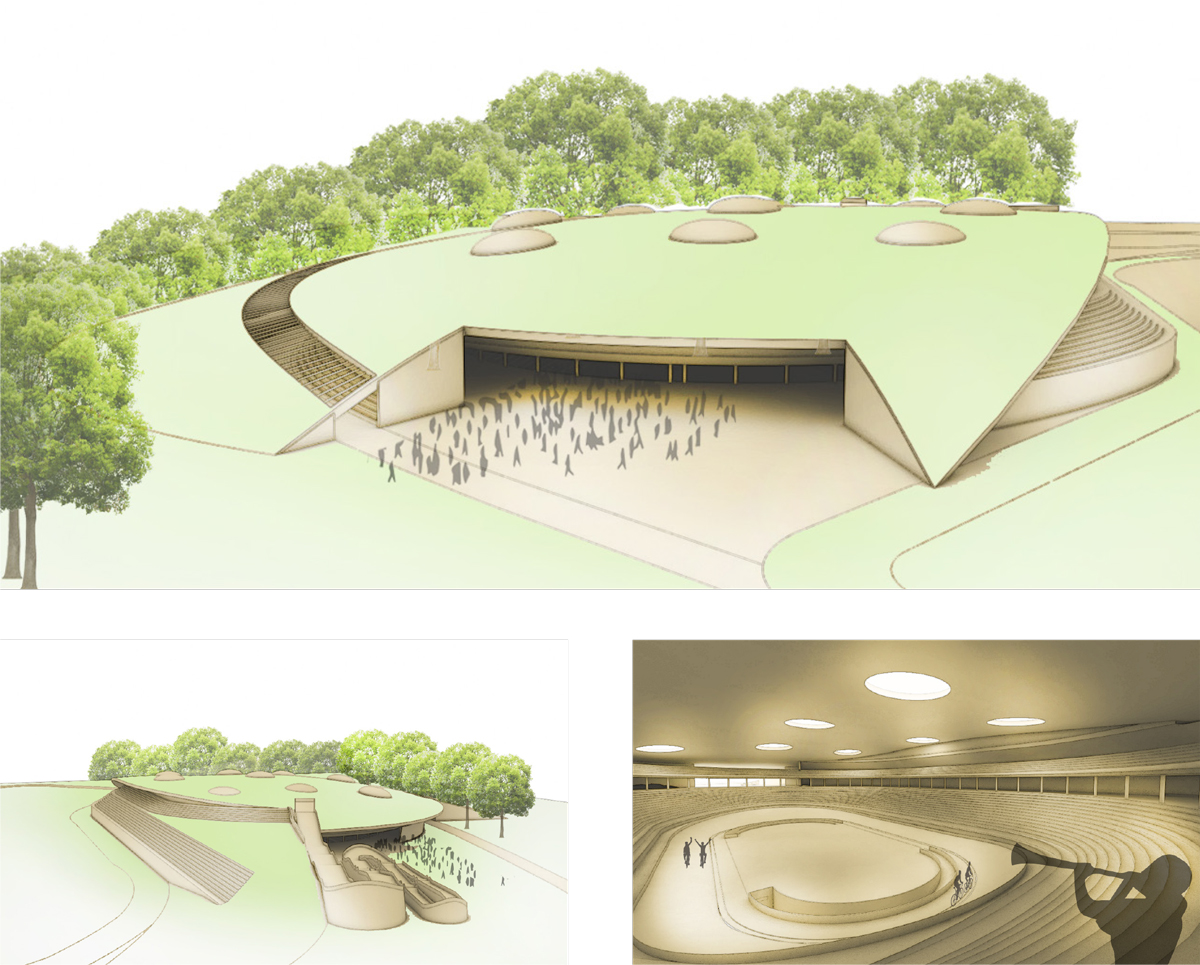
Perspective views of the National Cycling Centre
Economic Value
A similar comparison analysis has been undertaken to determine the economic value of the design proposal to Adelaide and South Australia. The figures put forward are conservative and are based on real “today” numbers.
It’s important to note that this project needs to be considered as a whole – each aspect of this proposal relies upon the others to deliver economic value to the city. Just undertaking one of the projects or locating an element within a different part of the city centre or metropolitan Adelaide will adversely affect the overall economic value.
The economic value analysis undertaken as part of this report focuses on the design proposal, and considers the projected economic benefit in terms of return on investment in dollars and permanent FTE jobs created.Comparisons used to determine these ratios have been based on recent United States and European projects. The methodology was to scale these projects to a comparable scale for Adelaide in order to deliver an accurate comparison and ratio.
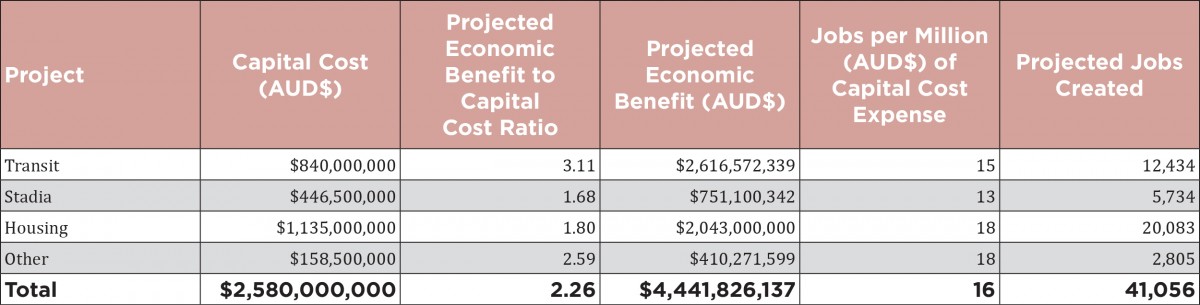
The table seen here combines the results of Stage 1 and 2 and demonstrates the total economic value of the design proposal up to 2030. It is important to note that this does not take into consideration the economic value of the Commonwealth Games as an event itself and as such event revenue streams from the Games, such as tickets and sponsorship, have not been included within these numbers.
What was achieved?
This report predicts an economic benefit to capital cost ratio of 2.26 with 41,000 jobs created. The benefit to cost ratio numbers sit within the “middle” of the range between conservative and aggressive. Based upon research of similar types of projects an estimated economic benefit to capital cost ratio of 1.75 to 2.75, with an estimated job creation of 30,000 to 50,000 full-time equivalent jobs would be an acceptable range. These figures and the corresponding ratios represent estimated capital costs and estimated economic benefits of core amenity and infrastructure across stages 1 and 2 of the proposed development. Estimated operational costs are not included, nor are estimated costs and benefits specifically associated with hosting the Commonwealth Games.
The report highlights different levels of benefit from individual element and notes that the benefit-to-cost ratio is slightly higher in stage 1 than in stage 2. This is due to the fact that the underlying mix of elements in each stage is different and each type of project carries with it a different ratio. For example, stadia are less economically beneficial relative to their costs compared to transit projects, which is reflected in the lower stage 2 ratio. It is also due to the fact that the transit projects in stage 2 are more expensive and less central than in stage 1, thus carrying a reduced benefit-to-cost ratio. It is important to remember that this is a holistic project and despite stadia’s having a lower cost to benefit ratio, they become a key amenity to the new residents that will ultimately live in the city centre and the South West Corner. Removing or relocating this amenity will ultimately reduce the project’s overall economic value.
Economic Case Study Comparisons
In recent years, cities have competed to secure the rights to host mega-sporting events, with the cost to bid for the event in the millions. Once successful, the cost to hold the event can be in the hundreds of millions to billions, depending on the event. So why do cities want to host such events? There are a number of reasons but the most compelling is the economic injection these events promise. There are many studies that demonstrate the economic windfall in hosting a mega-sporting event.
The real question is whether the economic benefit compensates for and outweighs the vast costs and substantial risks incurred (Barclay 2009) – are the Games Fools’ Gold (Baade and Matheson, 2004) or a lottery jackpot (Preuss, 2004)?
As we have outlined the costs associated with a mega-sporting event is not just the stadiums and sports infrastructure, it also includes public infrastructure like transit and accommodation for athletes. For the 2002 Commonwealth Games, Manchester spent double the investment on infrastructure compared to sporting facilities. This investment on infrastructure can be used to fast track much needed improvements in parts of a city where urban regeneration is required. This was certainly the case for East Manchester and the waterfront of Barcelona.
Two cities that have held mega-sporting events to drive urban regeneration legacy items and capitalise on economic stimulus from this legacy are the 1992 Barcelona Olympics and 2002 Manchester Commonwealth Games.
1992 Barcelona Olympic Games
The 1992 Barcelona Olympic Games are probably the best example of the role that a mega-sporting event plays in being a catalyst for urban renewal and change. The city’s traditional economic base was manufacturing and engineering, which suffered declines and increased pressure from globalization in the 1970’s and 80’s. Barcelona needed to reinvent itself with a new image, brand and a competitive economy which would be able to take advantage of the economic deregulation within Europe.

Key urban and economic legacy structures that remain in Barcelona.
Barcelona used the 1992 Olympic Games to fast track major urban improvement programmes, with particular focus around the Olympic village site at Parc de Mar. Before the Games, the 130ha site was occupied by declining industries and was isolated from the rest of the city and from the coast by two railway lines. The Olympics provided the catalyst to redevelop the site by restructuring the rail network, building a coastal ring road, the creation of a new marina, restructuring of the sewer system and the regeneration of the coastline. This development opened up the city to the sea by improving access to 5.2km of coastline for the inhabitants of the metropolitan areas (Valera and Guardia 2002). This investment in infrastructure has transformed this part of the city and has enabled future growth to occur over the subsequent years after the event was staged, to the point that almost 6,000 people resided in the area in 2008.
A less visible but nonetheless significant effect of the Games was the upgrading of the urban technology and telecommunications system necessary to host the world’s media. The fast tracking of infrastructure has assisted further commercial development of the city as an administrative centre.
R. Sanahya analysed the benefits to Barcelona in 2002, 10 years after hosting the games. His research highlighted that there was almost 100 percent increase in hotel capacity, number of tourists and number of overnight stays in 2001 compared to the pre-games position in 1990. Average room occupancy had also increased from 71 percent to 84 percent, while the average length of stay had increased from 2.84 days to 3.17 days. More tourists visited Barcelona from Europe and overseas than before the games. These figures have a tangible legacy for the local economy.
Barcelona was perhaps a ‘hidden’ city of Europe that needed a catalyst like the Olympic Games to break out. Barcelona spent $7.5billion to host the games, with the majority going towards infrastructure.
Only 13 sporting venues were constructed for the games, with 10 being refurbished and another 43 existing facilities used in their existing condition. The Olympic Games in Barcelona was the most expensive ever staged prior to Beijing, however the city’s use of the Games as a marketing factor is generally regarded as a huge success. This is evidenced by Barcelona’s rise in the ranking in the European Cities Monitor from 11th in 1996 to 6th in 2002. This level of investment has left a huge legacy for the city.
Manchester Commonwealth Games 2002
The Commonwealth Games are not the same scale as the Olympic Games but they are a multi-sports event that requires similar capital investment in sporting facilities and associated infrastructure in order for a city to be able to stage the Games.
Over 5,000 athletes attend the Commonwealth Games and an average of 700,000 visitors also attend (690,000 visitors to 2014 Glasgow Commonwealth Games). The Games held in Manchester involved an investment of £200 million in sporting facilities and a further £470 million investment in transport and other infrastructure. This was the largest investment related to a specific sports event ever to be undertaken in Britain prior to the 2012 London Olympics.
It was also the first time the planning of a mega-sporting event was integrated with the strategic framework for the regeneration of the city, with a particular focus made on East Manchester. One of the key strategic initiatives the Manchester Commonwealth Games committee undertook to maximise the economic return of the Games occurred three years before the event, with the establishment of the Commonwealth Games Opportunities and Legacy Partnership Board. This Board’s charter was to ensure that the benefits of hosting the event would not disappear once the event was over, rather that there would be a long term, permanent boost to the local economy of East Manchester (Gratton, Shibli and Coleman, 2005).
Post-game economic studies reveal that between 1999 and 2002, employment in East Manchester increased by 1,450 FTE jobs or a 4 percent increase over 1999 levels. The distribution of this increase was in construction (23 percent increase), hotels and restaurants (14 percent increase) and other services, such as recreational, cultural or sporting (24 percent increase) (Gratton, Shibli and Coleman, 2005). Such an increase in employment distribution is consistent with the Commonwealth Games event.

Key urban and economic legacy systems and structures that remain in Manchester.
Like Barcelona, Greater Manchester also noticed improved tourist numbers in 2002 compared to 2000. The report indicates that there was a 7.2 percent increase in overseas visitors, while interestingly there was a 6.4 percent decrease in UK resident visitors to Manchester. This is consistent with a ‘crowding out’ effect during the event. That said, since the event, Manchester’s tourism has risen steadily and is now close to 45 per cent higher when compared to 2000 numbers. Visit Britain data from 2012 ranks Manchester as the third most visited city in the UK after London and Edinburgh, attracting just under 8 million total visitors per year, which is 15 per cent more than 2011 alone (Rehman, 2012).
Much of the infrastructure expenditure for the Games went towards the 2,000ha of East Manchester which was characterised by postwar council flats and project housing, resulting in many social problems for residents and the community. This part of the city was targeted to have new housing, transport connections to downtown, the creation of employment and education opportunities within the area itself. A target in 2000 was set for 12,000 new dwellings to be built in the area. As of 2012, only 5,000 dwellings had been built. Despite not meeting the targets the project is still moving on, albeit at a slower pace given the recently depressed economy in the UK and the fact that much of the legacy funding has now been exhausted.
Despite this, the outcomes of the infrastructure investment remain successful, given that since 2000 there has been a 35 per cent fall in episodes of criminal activity within the area and a 51 per cent reduction in residents who feel that the area is unsafe. The percentage of residents dissatisfied in their area has also dropped from 43 per cent to 17 per cent from 1999 to 2012. It would appear that the urban regeneration is trending towards being an economic and social success (Rehman, 2012).
Although there is apparent success of this urban regeneration, some have criticised the approach by labelling it as gentrification. Andrew Smith comments that communities have simply been relocated to other parts of the city to make way for the amount of infrastructure required to deliver the event. Smith is also critical of the legacy funding approach which he claims does not run long enough after the event or suffers from under political pressure to be reallocated. The Manchester Commonwealth Games Legacy fund was operational for 4 years after the event (Menzi, 2010).
The same trend as seen in Barcelona was also evident in Manchester’s international profile, which has increased following the Commonwealth Games. Manchester moved up the ‘European Cities Monitor’ ranking from 19th in 2002 to 13th in 2003. This list compiled by Cushman and Wakefield focuses on the best European cities to locate a business. The report analyses access to workers, quality of available staff, office accommodation value for money and other factors that affect business. Despite the depressed national UK economy, Manchester has been able to maintain a competitive ranking of 12th on this list in 2011. The correlation to the infrastructure investment spent on the games has helped Manchester remain relevant and competitive in Europe.
A comparison could be drawn to Glasgow, which in 1990 was ranked 10th on this list, while in 2011 had dropped to 30th. When Glasgow recently held the 2014 Commonwealth Games, it was undertaken following a similar model to Manchester. Time will tell if they receive the same economic benefits, but early indications would suggest they are on a similar economic legacy path.
Conclusion
As Adelaide considers its economic and urban future, it is the long-lasting city wide legacy outcomes achieved by Barcelona and Manchester, that we have the opportunity to replicate.
Should Adelaide bid for the 2030 Commonwealth Games hoping for the glory that comes with a mega-sporting event or continue into an uncertain future, not knowing how long it will take to achieve the same urban regeneration without such an event? Our urban and economic challenges will be the driver for Adelaide’s political leaders in answering this question and ultimately considering the opportunity to bid.
What this report has highlighted is that Adelaide has a unique opportunity to play to its strengths and use an event strategy underpinned by the Commonwealth Games as a way to holistically address many of the city’s and state’s challenges and reposition South Australia on a sustainable development trajectory. This can be achieved while also redefining the way mega-sporting events can be delivered within an urban context.
The clock is ticking towards 2030 and Adelaide cannot afford to be idle. It now requires all levels of government, industry and the community’s support to achieve this vision for Adelaide.
David Cooke
Director, City Collective
David Cooke has the unique skillset of being an Urban Designer, Architect and a Planner. In 2014 David was the first South Australian to be awarded a prestigious scholarship to attend the University of California, Berkeley in their intensive Masters of Urban Design program. Upon returning to Australia, as Director of design and architecture studio City Collective, David is now applying international knowledge to address the urban renewal challenges that face Australian cities.
References:
Sergi Valera & Joan Guàrdia (2002) Urban Social Identity and Sustainability: Barcelona’s Olympic Village, Environment and Behavior, 34:1, 54-66.
Chris Gratton, Simon Shibli and Richard Coleman (2005) Sport and Economic Regeneration in Cities, Urban Studies, 42:5, 985-999.
Rehman, Najeeb, (2012) Commonwealth Games legacy lifted a part of Manchester out of the doldrums, Mancunian Matters, viewed 29 November 2014
Tony Menzi, ed, (2010) Social Sustainability in Urban Areas: Communities, Connectivity and the Urban Fabric, 220-231.
Holger Preuss (2004) Calculating the regional economic impact of the Olympic games, European Sport Management Quarterly, 4:4, 234-253.
Jonathan Barclay (2009) Predicting the cost and benefits of mega-sporting events, Institute of Economic Affairs, 9:6, 62-66.
Baade, R. and V. Matheson (2004) Mega-sporting Events in Developing Nations: Playing the Way to Prosperity?, South African Journal of Economics, 72, 5, 1084–1095.