How the Commonwealth Games could save Adelaide: Part One
Words: David Cooke
Above image: One of the first sketches of Adelaide, looking east over the city.

The problems that plague Adelaide have become normal to us, but that doesn’t mean normal solutions are going to work. While undertaking his Masters at The University of California, Berkeley, architect David Cooke came up with a radical plan for the city, which he unpacks in this four-part series.
Find the second chapter in this four-part series by clicking on this text.
People from Adelaide know we’re different and we know our state is too. We more than likely remember from our school history lessons that South Australia was the nation’s first non-prisoner white settlement, and that this started a series of firsts for the state.
South Australia was the brain child of free political thinkers from the United Kingdom, who were keen to create a new state based on their social, political and lifestyle principles. The capital of this new state needed to reflect these ideals but simultaneously offer an urban environment that reflected this vision and a lifestyle unattainable within current day England. In fact, Adelaide could be likened to an 1800s property development – it needed to be innovative enough to entice budding immigrants to make the long journey for eight months to be part of this new city.
The aspirations for Adelaide were to deliver a new urban utopia that offered a high-quality lifestyle, linked to open space that could not be found in the United Kingdom. As with many colonial cites, military principals were used to determine the layout of the city grid with units measured using the chain system.
Light’s resulting 1837 plan for Adelaide, with the hierarchy of streets and inter-locking open space, remains very evident within the urban structure of the city today and is often used as a reference point for future city planning. But how much of the city centre we experience today was actually designed by Light?
Adelaide Today
In 1880 a survey was undertaken in preparation for the installation of the city’s first comprehensive sewerage removal treatment system. As part of this public infrastructure work, the resulting map, Charles Smith’s Book Plan of South Adelaide, clearly depicts how initial land owners of Light’s one acre parcels had started to urbanise the city and evolve Light’s grid. The deficiency of Light’s initial grid was north-south connectors. Over the first 40 years, land owners had started to create laneways and roads, primarily running north-south to gain access through their one acre parcels. (Gehl, 2013) There appears to be no real strategy for this extra layer of the city grid. The laneways and roads are located in a haphazard fashion within the parcels. Some lanes are located adjacent the boundary line of the one acre parcel, some are located in the centre. Common ownership of adjoining parcels also saw some lanes straddle over the original parcel lot lines. The overall size of the lanes varies also. There is no hierarchy or uniform lane size present as there was in Light’s initial street grid.
It is plausible to assume that many of the lanes are simply designed to allow access for a horse and cart, fundamentally to clean cess pits, remove waste, access horse stables and the storage of building materials for the developing city. The open space squares remain in this survey but it is noted they become smaller in size and more defined by streets passing around them and parcel access linking the open space.
As the city plan and grid evolved we have paid respect to some of the initial design parameters however have broken many of the key elements. Today the current configuration of the squares remains divided in terms of their access and legibility as civic open space. What was once the right of way of the tram route, has now been replaced with roads. The squares are now nothing more than traffic islands (Collis, 2007). The current plan of Adelaide also clearly still references Light’s initial plan of a predominantly east-west street grid and hierarchy and the elongated super blocks that this created.
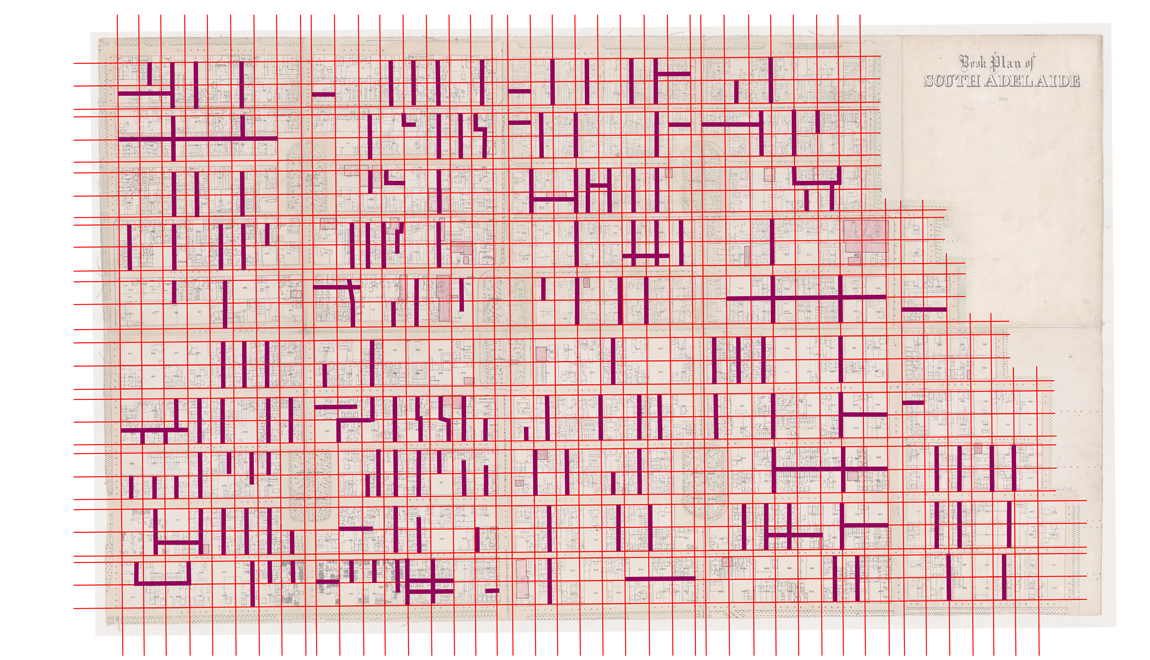
This image highlights where the lanes and news streets had been created in relation to Light’s parcel grid.
In overlaying the one acre parcel gird it still remains in tact but there is little structure in terms of urbanisation of these parcels. The haphazard approach we identified in the 1880 Book Plan has continued with individual owners and city governments influencing and controlling this evolution of the grid on a project by project basis. The result is an illegible and confusing street pattern of laneways with none of the order and hierarchy of the original street layout Light planned. This once compact urban city now sprawls over 80km north and south. The question must be asked: What happened to the compact city Colonel Light envisioned and how can we evolve the vision in a contemporary setting?
Today Adelaide is a city that is struggling to gain recognition, both nationally and internationally. Once the third largest city in Australia in the early part of the 20th Century, boasting a strong cultural identity of arts, festivals and education, while being considered politically and socially innovative with respect to public policy, the city is now often used as the punch line for jokes. Adelaide’s population of 1.29 million sounds impressive is most certainly an achievement. But, there are 255 cities around the world of a similar population size (World Atlas, 2015). No matter how they have reached this level of population, either by growth or decline, they all have one thing in common – they are all competing against each other and larger cities to attract people, investment, recognition and opportunities to elevate their city’s position and ranking. Adelaide is right in the middle of this log-jam.
The Plan for Greater Adelaide, a major planning policy document released by the Government of South Australia in 2010, records Adelaide’s forecast annual growth rate as 18,000 people per annum, which over 30 years would see an additional 540,000 residents of metropolitan Adelaide and total population of 1.83 million by 2040 (30 Year Plan for Adelaide, 2010). It is also interesting to note that the current projection of 18,000 people per annum or 350 people per week has also been indicated in the current 2016 Draft Update of the 30 Year Plan for Greater Adelaide. These targets have been re-set despite not being achieved to the anticipated level in first five years of the plan.
If Adelaide wants to be a larger city over the coming years, it needs to be on at least its projected growth trajectory already. Adelaide is not already on an accelerated growth trajectory like Melbourne or Brisbane, and therefore has likely missed that opportunity over the upcoming years. That said, Adelaide potentially holds a unique position within the Australian city context in terms of population size, which needs to be considered and acted upon as a positive opportunity. In a country of cities – which is what Australia is increasingly becoming – Adelaide has the opportunity to own the 2 million city population space within the nation.
Adelaide’s Challenges
Within the context of Adelaide’s urban history and the current demographics, population and the economy, Adelaide’s current and future challenges can be defined in six main categories.
– Population growth adding to urban sprawl
– Low city centre residential population
– Low metropolitan housing density
– Automobile dependence
– Aging population
– Low population growth
Population growth adding to urban sprawl
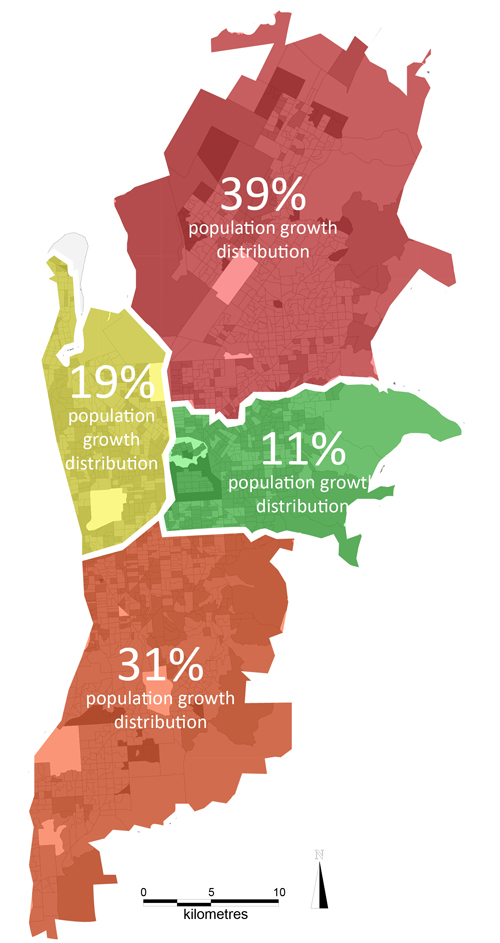
Adelaide has been growing modestly over the past decade, on average by 1.3 per cent annually. During 2008 to 2013, metropolitan Adelaide increased in population by 68,000 people. What is of interest is where these new residents chose to live in metropolitan Adelaide. The map adjacent indicates that 70 per cent of the new residents chose to live in outer metropolitan areas, north of Grand Junction Road and south of Cross Roads, which in turn contributes to metropolitan Adelaide’s urban sprawl (Government SA Population Change, 2013). So why did these residents chose to live in these areas? The Australian Bureau of Statistics data indicates that house prices are more affordable in these outer metropolitan suburbs than closer to the city centre. It is plausible to assume that this would have been a key contributing factor in many of the new resident’s decision making along with real or perceived greater access to amenity, such as open space, schools, services like shops and community centres.
According to the Australian Urban Research Infrastructure Network’s VAMPIRE Index, which is an acronym for Vulnerability Assessment for Mortgage, Petrol and Inflation Risks and Expenditure, these new residents along with all residents in the outer metropolitan suburbs are under higher risks to fluctuations in oil (gas / petrol) prices, inflation and interest rates (VAMPIRE, 2014). The level of risk residents of outer metropolitan suburbs face was dramatically exposed in the United States during the 2008 to 2009 Global Financial Crisis (GFC). During the GFC it was the housing stock located in the outer metropolitan areas of North American cities that seriously suffered, as houses lost capital value, residents could no longer meet payments nor could they sell their properties to pay down debts, resulting in foreclosure and personal bankruptcy. This situation was also exacerbated by the reliance of many residents in these outer metropolitan areas on private automobiles for transportation, as residents did not have the option to reduce daily transport costs. (Reid, 2014)
Low city centre residential population
According to the ABS 2011 data, Adelaide has only 13,000 people who live within the city centre (excluding North Adelaide), which is 1 per cent of the metropolitan city’s population. This figure is potentially closer to 16,000 now with the current influx of residential development that has occurred in the city, however this number is dangerously low when compared to similar size cities. The age demographic is focused around younger people and elderly people making up the residential population and this limited diversity compounds the issue. The high student population, while it adds city vibrancy, also results in significant churn which is difficult to manage.
Low metropolitan housing density
Metropolitan Adelaide’s housing stock consists of 77 per cent single family detached houses, which is above the national average of 70 per cent. The average density of metropolitan Adelaide is 18 persons per hectare. The work by Professor Peter Newman from Curtin University, Western Australia highlights the hidden costs differences between urban and suburban developments. He states that ‘1000 houses built on the fringe of Australian cities cost $300 million more than a 1000 houses built within existing city growth boundaries’ (Newman, 2008). Such data is highly relevant in Adelaide’s case as the city continues to grow in the outer metropolitan areas.
Automobile dependence
Adelaide’s current transit system is a combination of metro rail, light rail (trams), O-Bahn bus (tracked bus) and bus. The system predominately is a hub and spoke approach, where transit routes originate from the city centre and spread to outer metropolitan Adelaide. There are some outer metropolitan interchange nodes within the network. Adelaide once had an extensive tram network that linked the suburbs to the city centre. As the metropolitan area of Adelaide expanded post 1950, the tram network was replaced with the current bus network.
Many citizens of Adelaide colloquially lamented this decision at the time and look longingly over the border to Melbourne’s extensive tram network as to what might have been for Adelaide. The current public transit routes potentially contribute to Adelaide’s urban sprawl, as they ultimately enable people to live in the outer metropolitan suburbs, while working within the city centre. Adelaide’s transit system attracts many of the usual complaints directed towards public transit systems, such as not being reliable, late, irregular timetabling, full or overcrowded and expensive. Given these issues, many residents of Adelaide choose to drive as their preferred method of transport rather than use public transit.
Adelaide Metro data from 2013, states that its average daily ridership is approximately 33,000 riders, which equates to 2.5 per cent of the population. Of that ridership, 80 per cent of passengers are using bus, 15 per cent use train and 5 per cent use tram (Adelaide Metro, 2013).
Without a large ridership on the transit system it becomes hard for the government to afford or decide to invest in improving or extending the network. The government would be aware that the majority of citizens, and voters, would most likely prefer improved road networks. In 2015 State Budget, the Government committed to spending $332.8m on seven road projects compared to $16 million on two rail upgrade projects. Furthermore, the budget indicated that public transit tickets will increase by 2.5 per cent (Government SA 2015 Budget Papers, 2015). That said, currently the State Government is undertaking a integrated transit planning study, AdeLINK, which is examining how to deliver an efficient and effective public transit system for metropolitan Adelaide. A key aspect of this study is the re-installation of a light rail network. Time will tell how this is delivered to address Adelaide’s automobile dependence.
This trend in government spending towards road infrastructure is not uncommon. A report by Sustainable Prosperity from Canada highlighted the allocation of all government spending on road infrastructure in Canada was CAD$28.96 billion compared to CAD$7.5 billion invested in Transit. With over CAD$13 billion of that allocation funded by non-road users, such as public transit passengers. (Thompson, 2013) The result for metropolitan Adelaide is that car ownership in Adelaide is above the national average, with 62 per cent of passenger cars owned per 100 population compared to the national average of 57 per cent passenger cars per 100 population. This equates to 0.76 cars per person in South Australia, compared to the national average of 0.72 cars per person. Adelaide households have 1.7 cars per household compared to 1.5 cars per household nationally. Adelaide is following the national trend of automobile dependence for transportation, albeit slightly above. There is an opportunity to break from the pack and set a new trend for the direction of transportation in Adelaide (Allianz, 2011).
Aging population
Currently Adelaide’s population average age is 39 years old, compared to a national average of 37 years old. According to the Intergenerational 2015 report, this trend is expected to continue with Adelaide forecasted to have an average age of 47 years old in 2055, compared to a national forecast average of 44 years old. South Australia has an annual average interstate migration loss of 3,300 people per annum, with a higher recording of 5,000 South Australian’s lost interstate last year. This a worrying number, however what makes this somewhat worse and adds to the average age issues is that according the ABS, 50 per cent of this interstate migration consists of people aged between 25 to 44 years old of age. (ABS, 2015)
Such a trend reflects an economy in transition as South Australia moves away from a manufacturing base economy to a more professional service, knowledge based economy, where the higher positions of this industry are not available in South Australia.
Low population growth
Over the past few years Adelaide has been under the forecast annual growth rate of 18,000 people per annum and is in fact achieving a population growth closer to 12,000 per annum or an average of 0.9 per cent. It’s important at this stage to acknowledge that this is still a positive number and the city is still growing. Some North America cities like Cleveland, Buffalo, Pittsburgh and Detroit would like to have Adelaide’s positive growth number, rather than the declining population numbers they have experienced over the last decade (ULI, 2014).
In an Australian context, however, Adelaide is becoming somewhat of an only child city. The Federal Governments Intergenerational 2015 report on the state of Australia forecasts that Adelaide’s population will grow to 2.2 million by 2055. This growth can be considered modest when compared to the other Australian capital cities. The report forecasts that by 2055, Australia’s national population will almost double up to 39 million. (Intergenerational Report, 2015) Of that, the areas that will see the most growth are Melbourne and Sydney, which will grow from their current populations of over 4 million people to cities of 9 million people. Perth and Brisbane will maintain their current growth trajectory and result in cities of the size of almost 5 million people. While Hobart, Darwin and Canberra continue to grow, these cities are coming off such a low base, their percentage of Australia’s population within 2055 remains relatively small. As highlighted, this needs to be seen as a positive opportunity for Adelaide to become Australia’s 2 million population city.
Conclusion
While I’ve outlined the challenges we face, this is not intended to be a shopping list of negatives, but instead a chance to understand the opportunities we have to play to Adelaide’s strengths.
The challenges that confront the City of Adelaide need to be addressed. The city needs to correct the urban development trajectory that it is currently on, as this path is unsustainable. In considering approaches to address these challenges there is no quick fix or silver bullet. There needs to be a long-term, well-planned approach underpinned by city-wide community and political ownership with a deadline or clear goal to create momentum.
In order for Adelaide to fully utilise its strengths, I propose to rely on Adelaide’s successful history of hosting events and to follow an event-led strategy, which includes a mega-event, in conjunction with smaller events. If we did this, Adelaide’s successful track record for art, cultural, music and sporting events could become the foundation for success with a larger, more international scale of event.
A recent Urban Land Institute (ULI) report considered the impact of mega-events on cities throughout the world. The report compared eight event types from sports, music, politics, economic and cultural and then analysed each event in relation to city and state wide impacts on visitors, transport, urban infrastructure, culture, sports infrastructure, identity, business confidence and visible legacy (Clark, 2013). The report highlights that mega-sporting events, like the Olympic Games or Commonwealth Games has the greatest impact across all these aspects of a city. Further analysis considered the spatial impact of the event on the host city and nation. Mega-sporting events have demonstrated positive impact on the host both at the city level and beyond.
The report also recommends cities bid for a series of events to offset their costs more effectively and reduce the risk of focusing on one event for success. This was certainly the approach for Manchester, UK that focused on a series of bids for sporting events, that included the 1992, 1996 and 2000 Olympic Games, before being awarded the 2002 Commonwealth Games. The city also built key infrastructure early, as a way to demonstrate their commitment (Najeeb, 2012).
A possible way for Adelaide to address these current challenges is to bid for a mega-sporting event, such as the Commonwealth Games, and use this event as a catalyst.
In future instalments, I will explore how a one-time sporting event, like the Commonwealth Games, could be the catalyst that improves Adelaide’s longer term urbanity, connectivity and city centre vibrancy.
David Cooke
Director, City Collective
David Cooke has the unique skillset of being an Urban Designer, Architect and a Planner. In 2014 David was the first South Australian to be awarded a prestigious scholarship to attend the University of California, Berkeley in their intensive Masters of Urban Design program. Upon returning to Australia, as Director of design and architecture studio City Collective, David is now applying international knowledge to address the urban renewal challenges that face Australian cities.
References:
Populations of the World’s Cities, viewed 14 November 2014, http://www.worldatlas.com
The 30 Year Plan for Greater Adelaide – A volume of the South Australian Planning Strategy, Government of South Australia, Department of Planning and Local Government, viewed 22 June, http://www.dpti.sa.gov. au/__data/assets/pdf_file/0006/132828/The_30-Year_ Plan_for_Greater_Adelaide_compressed.pdf
Australian Urban Research Infrastructure Network, Vulnerability Analysis of Mortgage, Petroleum and Inflation Risks and Expenditure (VAMPIRE) Index, viewed 8 July, http://aurin.org.au/projects/lens-sub-projects/vulnerability-analysis-of-mortgage-petroleum-and-inflation-risks-and-expenditure-vampire-index/
Reid, C, 2014, ‘Transformations in Urban Housing’, Masters of Urban Design Lecture Series, 21 November 2014, Berkeley, CA, United States.
2015-16 State Budget, Government of South Australian, viewed 8 July, http://www.statebudget.sa.gov.au/
Australian Bureau of Statistics, viewed 8 July, http://www.abs.gov.au/websitedbs/c311215.nsf/web/States+and+Territories++South+Australia
Newman, P, & Jennings, I, 2008, Cities as sustainable ecosystems: principles and practices, Island Press.
Thompson, D, 2013, ‘Suburban Sprawl: exposing hidden costs, identifying innovations’, Sustainable Prosperity, University of Ottawa.